Blog
Why You Should Use Infographics With Your ELLs - And How To Get Started

Blog
Why You Should Use Infographics With Your ELLs - And How To Get Started
It seems as though infographics are everywhere these days. From advertisements and newspapers to Twitter and Pinterest - I see them several times a day. Why are they so popular? And how can you use them with students, specifically English Language Learners, to increase motivation and performance in your classroom?
Infographics are visual representations of data or knowledge intended to present information concisely and quickly. Since they incorporate pictures and graphics, infographics are easy to understand and effective for communicating a large amount of data. In the past few years, infographics have gained popularity and as a result there are many free web-based tools to help those without a budget or design background build one. This means that you, too, can create high quality infographics and even engage your students in the process.
Using infographics in the classroom is a powerful way to scaffold instruction for your ELLs and deliver grade level content while meeting your students’ language needs. Studies also show that 90% of the information human beings remember is based on visual impact. Therefore, infographics are a great way of presenting content that is likely to be retained. When content is delivered solely through oral language or text, students with limited English proficiency will struggle. Providing visual supports while teaching is a powerful scaffold for ELLs as it helps them grasp the context and meaning behind the text.
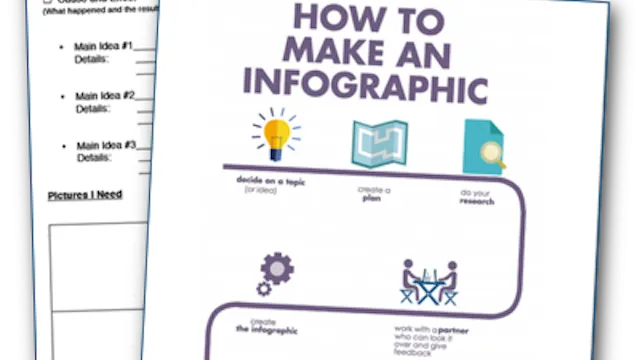
Teachers often find that infographics are great for instruction, but why not start from the beginning and build infographics with the entire class? Turn your students into teachers by having them build and create their own infographics. These projects will allow students to demonstrate content learning, regardless of language proficiency level. Use this helpful student planner for grades 3 - 12 to support students in organizing and planning their project. Here are four steps ELL specialists and classroom teachers can take with your students to get started.
1. Choose the purpose
As is true of most effective writing, infographics need to serve some type of overall purpose. Decide if the purpose of the infographic is to persuade, inform or entertain. If students are tasked with building a persuasive infographic, be sure to provide signal words. For an informational infographic, teach students how to check their sources and only show factual information. Entertaining through infographics is possible, just make sure your students think about the pictures they emphasize and remind them not to be offensive. The purpose of an infographic may be challenging for your ELLs as each purpose has some implied meaning. Spend some time modeling examples - seeing end products will really help them!
2. Map out the main ideas
Infographics can help your students understand how to piece together segments of content to tell a story. In order to do this, your students must learn the critical skill of mapping supporting details to an overarching main idea. Don’t assume this will come easily to them. In fact, many students will benefit from using a graphic organizer like this one from TeacherVision to really make their planning clear and purposeful.
3. Choose the right infographic
After your students have viewed and discussed a number of infographics examples, and finished their planning, they will be ready (and likely very eager!) to actually start creating. Don’t be afraid to let students explore these applications on their own or in groups- but also be available to support. Here are some free, student-friendly resources you might use:
-
Piktochart - a Chrome App with pre-made templates that can be used with google accounts
-
Visualize.me - Quickly turns a resume into an infographic
-
Easel.ly - All templates are free, can try before signing up with free account
-
Infogr.am - Best to use for making charts and graphs
-
Venngage - Easy to use, has many free templates and graphics
4. Decide on visuals and build graphics
When your students are choosing an image, make sure to ask if the image is necessary, helpful for the purpose and appropriate. All of the resources above come with their own image, but your students may need more. Infotopia and Infotrek are safe search engines for students to find school-friendly images. Google Images is always an option, but be wary of the appropriateness and copyright of some pictures.
As a follow up, have your students write a short paragraph or summary of the topic using language from their project. Your students will have had so much fun making the infographics that they won’t even realize they’re developing their English language skills!
Have you successfully implemented any infographic projects with your ELLs? If so, please share lessons learned or advice below for others looking to get started.